Benford’s Law
Today, we’re going to talk about a very interesting topic – Benford’s Law and how it can help detect unusual accounting practices or in general unusual number patterns in many data sets.
Benford’s Law is a mathematical principle that can be used to identify potential accounting irregularities.
Benford’s Law equation
It states that in a large dataset of naturally occurring numbers, the frequency of digits 1 through 9 in the first position of those numbers will not be evenly distributed.
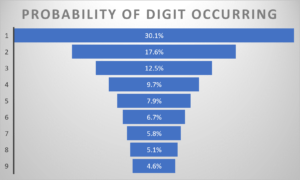
Benford Distribution
This means in the number 2354 only the 2 in the beginning will be used for analysis. Or in the number 72458 only the number 7.
Instead, the frequency of each digit follows a predictable pattern, with the number 1 appearing most frequently and 9 appearing least frequently.
This distribution is known as the Benford distribution.
Let’s say a company or charity has a financial report with a lot of numbers.
Using Benford’s Law, we can analyse the first digit of each number in the report to see if it follows the expected distribution.
If the distribution of digits in the financial report is significantly different from the Benford distribution, it could be a red flag that something unusual is going on.
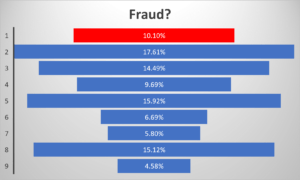
Divergence from Benford’s Law
For example, let’s say a company or charity reports revenue numbers that start with the digit 9 much more frequently than expected under Benford’s Law.
This could indicate that the company is manipulating its revenue figures to make them appear higher than they actually are.
Therefore a manipulated financial report might show a different pattern of digits that is inconsistent with the Benford distribution.
Forensic accountants and data analysts can use Benford’s Law as part of their analysis to detect potential accounting irregularities.
In fact, there have been several cases where forensic accountants have used Benford’s Law to uncover fraudulent accounting practices.
The utilisation of Benford’s law for fraud detection is for example permissible in US courts at the local, state, and federal levels.
This approach has successfully identified anomalies in Greece’s EU application and investment return data for Ponzi schemes, including Bernie Madoff‘s scheme.
Nevertheless, it is essential to consider several crucial factors.
If a dataset that is expected to conform to Benford’s
distribution does not follow it, it merely serves as a warning sign, not proof of fraudulent activity.
Auditors and investigators must still be dispatched, but the focus can be directed towards questionable records.
Moreover, not all data conform to Benford’s law organically.
In such cases, leading digits that do not adhere to the expected distribution do not indicate fraudulent behaviour.
Therefore, it is critical to understand which datasets are appropriate for comparison, which is discussed in the following section.
Benford’s law is typically applicable to data that meets some of the following criteria:
As we are dealing with numbers the data can only be quantitative for Benford’s Law.
Data that are measured rather than assigned.
Here we mean that the values are obtained by some sort of measurement or observation, rather than being assigned or chosen arbitrarily.
For example, a dataset of employee salaries would be considered measured data because the values are determined based on the salary rates that are established through negotiations or other objective criteria.
In contrast, a dataset of employee ID numbers would be considered assigned data because the values are assigned arbitrarily by the employer.
In general, measured data is more likely to conform to Benford’s law because the values are determined by some underlying natural process or phenomenon, whereas assigned data is more likely to be subject to human biases or preferences.
Ranges over orders of magnitudes.
This means that the data values differ by multiples of 10.
For example, a dataset that includes values ranging from 1 to 10,000 spans four orders of magnitude because the values differ by a factor of 10^4 (i.e., 10000).
Not artificially restricted by minimums or maximums.
Here we mean that the range of possible values is not artificially constrained by arbitrary rules or limits.
For example, if a dataset includes test scores that are artificially restricted to a maximum of 100, then it would not be appropriate to apply Benford’s law to this dataset because the distribution of leading digits may be distorted as a result of the artificial ceiling.
In the context of Benford’s law, mixed populations refer to datasets that contain values from different sources or populations that are not necessarily related to each other.
For example, a dataset that includes revenue data
from different industries, countries, or time periods would be considered a mixed population dataset.
Benford’s law is often applied to mixed populations because it is a tool for detecting anomalies in the distribution of leading digits that may indicate errors or fraud in the data.
When analysing mixed populations, it is important to consider the potential variations in the distribution of leading digits that may occur across different sources or subgroups within the dataset.
Therefore, applying Benford’s law to mixed populations requires careful analysis and interpretation of the results to determine which subgroups or sources may be driving any observed anomalies.
Larger datasets are better for applying Benford’s law because they provide a more representative sample of the underlying population and help to minimize the impact of random variations or outliers.
Remember – Benford’s Law is a powerful tool that can help identify potential number irregularities.
Please visit our videos about Mixed Methods Research Designs, Quantitative versus Qualitative Research and Cross-Sectional Data Collection.