Population adjusted Covid-19 deaths in Scotland
We have written a CORONAVIRUS COVID-19 R shiny app that shows the deaths in Scotland adjusted by population. By this measure Drumchapel South, was worst hit by Covid-19.
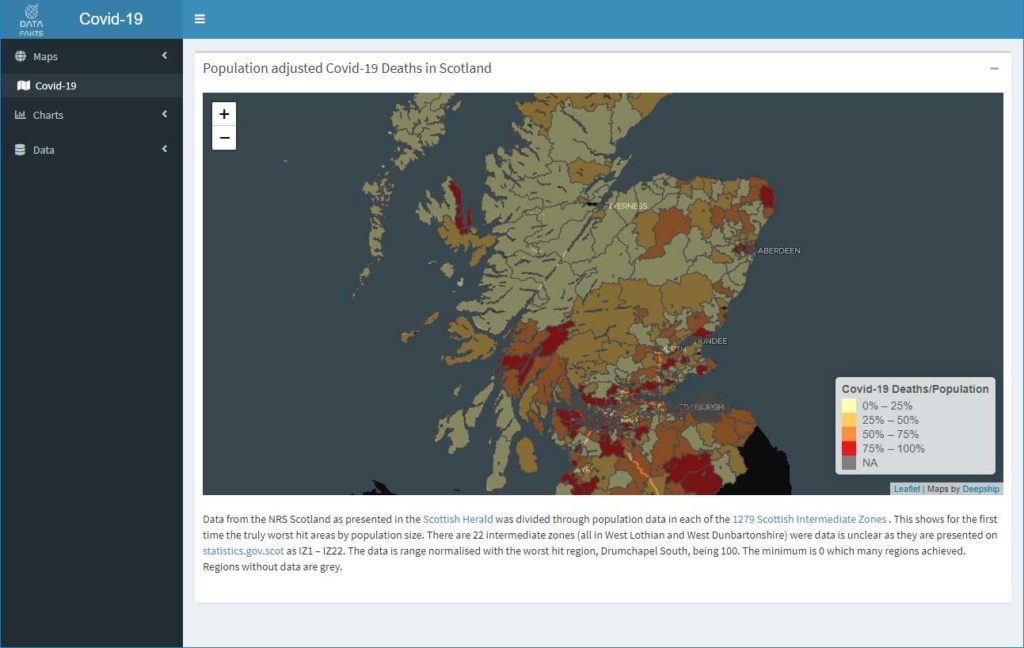
The R app can be accessed here.
We have written a CORONAVIRUS COVID-19 R shiny app that shows the deaths in Scotland adjusted by population. By this measure Drumchapel South, was worst hit by Covid-19.
The R app can be accessed here.
Follow @datafakts Tweet to @datafakts Mapping and providing services for people who are socially isolated has never been so necessary, but, while the pandemic has made it more topical, the need for these services is Read more…
Follow @datafakts Tweet to @datafakts Datafakts eagerly anticipated report on deafness and mental health in Scotland (with a special mention regarding the ongoing Covid 19 Public Health Emergency) is now downloadable in the Queen Margaret Read more…
Follow @datafakts Tweet to @datafakts On the 7th of August Andrena McMenemy from DataFakts talked about Deafness and Dementia at the Alliance Live Event about the Research we carried out in collaboration with Queen Margaret Read more…
| © 2023 Data Fakts Ltd (SC617363) |